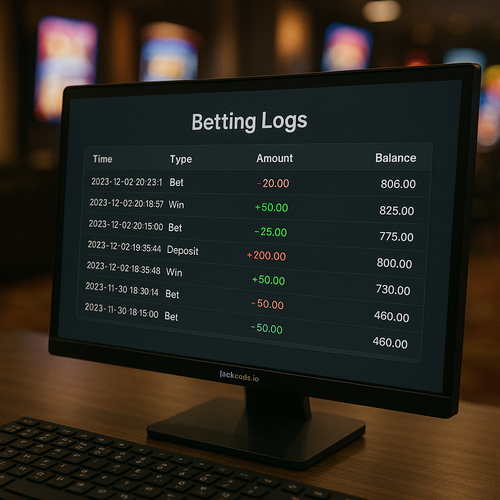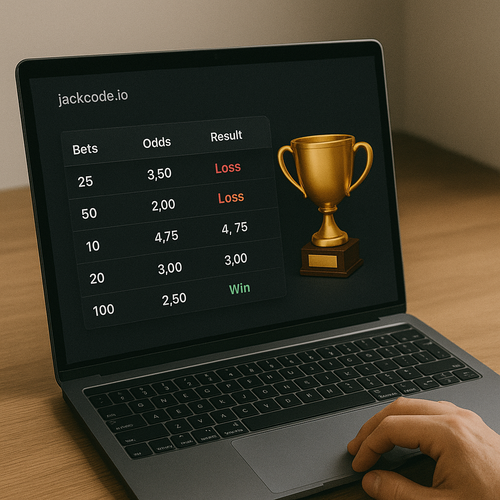
Operational decision-making begins with data submitted correctly. We implement interactive dashboards in the back office that reflect platform profitability, user engagement and retention rates. All information - in real time, with the ability to filter by dates, traffic sources, countries, channels and segments of players.
Dashboards allow you to quickly understand where the platform earns, where it loses, and where you need to strengthen retention or marketing.
Key figures
| Metrics | What displays |
|---|---|
| Income | Gross and net income, by day, week, source, provider |
| Player activity | DAU/WAU/MAU, number of bets, length of sessions, number of deposits |
| Retention | 1-7-30 days, return visits, delayed return, cohorts |
| Bonus load | Percentage of bonus bets and expenses, stock reaction |
| Traffic and registration | New users, funnel entry, paying vs non-paying |
Dashboard functions
Period selection and grouping by day/week- Segment comparison (new vs loyal, VIP vs regular, etc.)
- Filtering by geo, devices, traffic sources
- Custom graphs, tables, KPI blocks
- Export graphs to PDF/PNG/Excel
- Distribution of scheduled reports
Advantages
Fast, up-to-date decision making- Tracking the performance of stocks, partners and sources
- Identifying weaknesses: activity rollback, loss of hold
- Increased transparency for management and analysts
- Ready for presentations, investment sessions and audit
Where especially important
Big data casinos and betting platforms- Fintech products with daily payment activity
- Applications with P2E, gamification and bonus model
- Subscription and re-purchase platforms
Dashboards are a visual product control center. We will create an interface in which you will see everything from income and activation to retention and problem areas - quickly, clearly and on one screen.
Contact Us
Fill out the form below and we’ll get back to you soon.


